
[Representation Learning] What Do Self-Supervised ViTs Learn?
For self-supervised learning of Vision Transformers (ViTs), contrastive learning (CL) and masked image modeling (MIM) emerge as two predominant techniques. Park et al. 2023 reveal that contrastive learning and masked image modeling impart opposite forms of knowledge, thereby offering a strategic guide for model application.
Brief Summary
- Behavior of Self-Attention
CL primarily captures global relationships, while MIM captures local relationships. Self-attentions of CL in the later layers for all query tokens and heads collapse into homogeneous attention maps. In such cases, most self-attention maps focus on object boundaries, meaning that they can capture object shapes but may lose interaction diversity between tokens.- CL: good for linear probing and classification tasks with smaller models
- MIM: scalable and better dense prediction performance
- Transformation of the representations
CL utilizes the low-frequency signals of the representations, but MIM utilizes high-frequencies. Since low- and high-frequency information respectively represent shapes and textures, CL is more shape-oriented and MIM more texture-oriented. - Position of lead role components
The later layers in CL and early layers in MIM play a key role, since- early layers are usually known to capture low-level features
- e.g., local patterns, high-frequency signals, and texture information
- later layers are usually known to capture high-level features
- e.g., global patterns, low-frequency signals, and shape information
- early layers are usually known to capture low-level features
Behavior of Self-Attention
Global v.s. Local Relationships
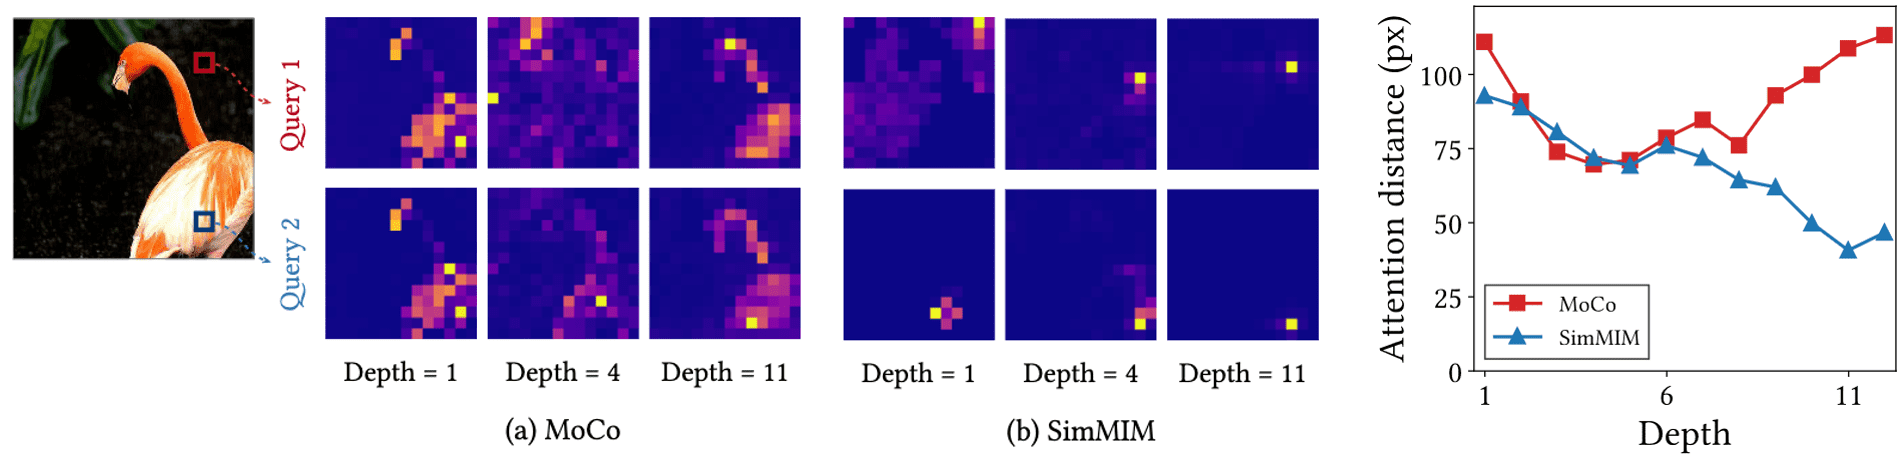
Self-attention of ViT allows the model to integrate information across the entire image even in the lowest layers. Specifically, this can be measured using attention distance, the average weighted distance between the query tokens and key tokens by self-attention weights:
\[\frac{1}{N} \sum_{j=1}^N \sum_{i=1}^M A_{ij} \Vert \mathbf{p}_i - \mathbf{p}_j \Vert_1\]for attention matrix $A \in \mathbb{R}^{M \times N}$ where $\sum_{i=1}^M A_{ij} = 1$ where $\mathbf{p}_i$ represents relative spatial location of $i$-th token $(x_i/W, y_i/H)$ for feature map $F \in \mathbb{R}^{H \times W \times C}$.
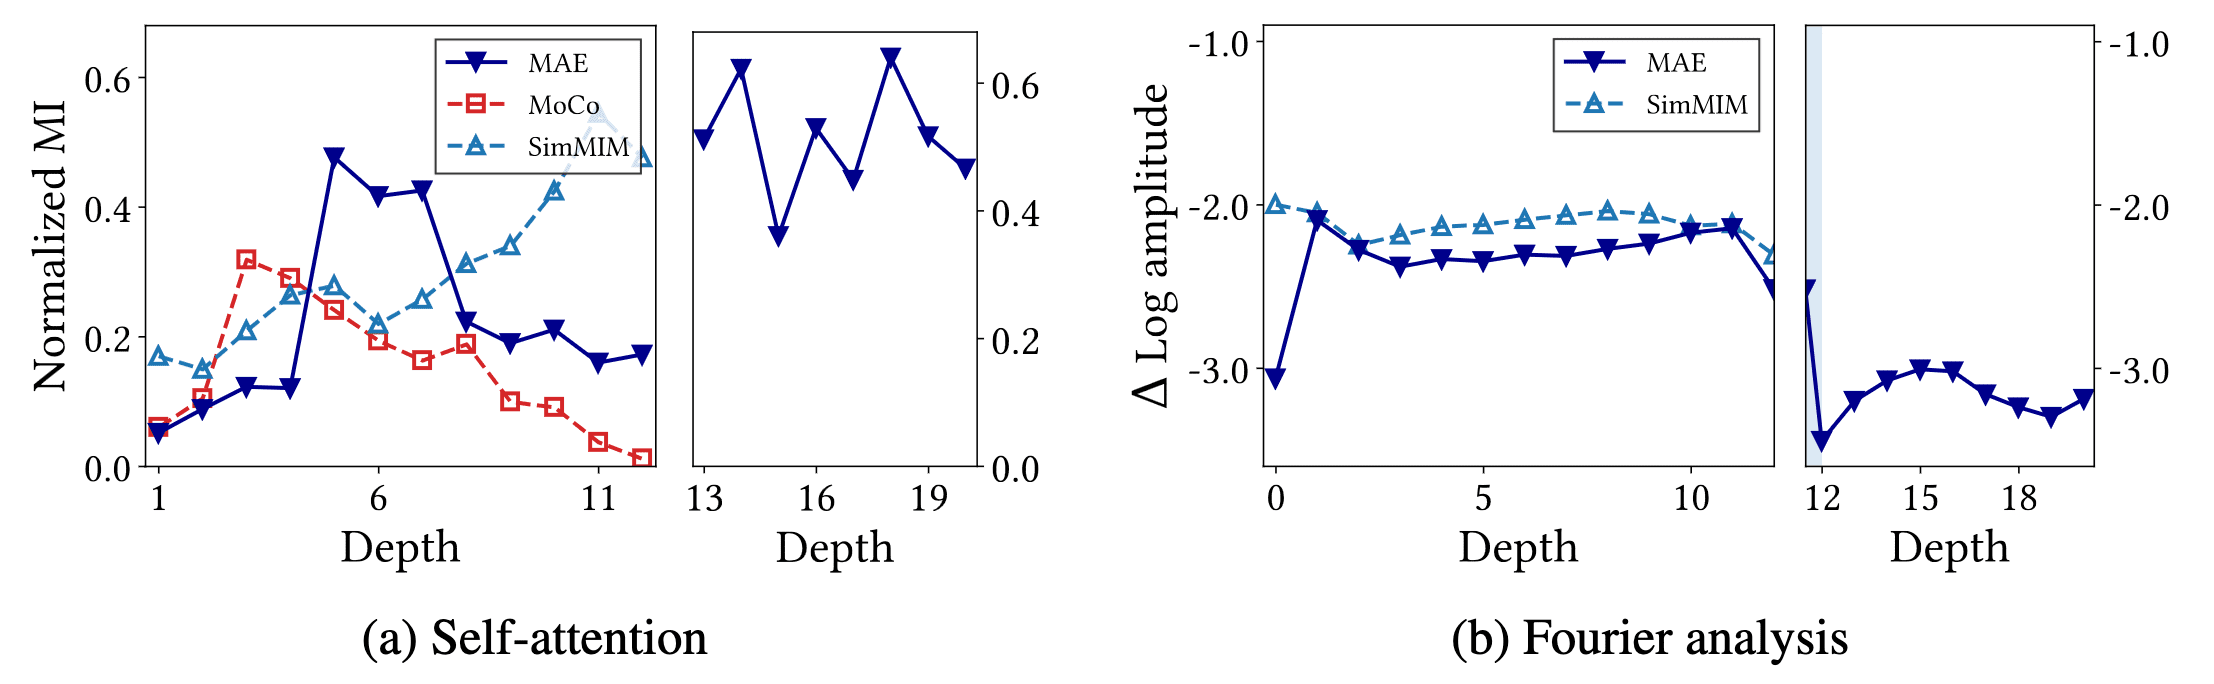
In the experiment, ViT models self-supervised via CL (MoCo) demonstrate significantly higher attention distances compared to those using MIM (SimMIM), particularly in the later layers. This pattern is also evident in visualizations; self-attentions in CL capture global patterns and the overall shape of an object, whereas self-attentions in MIM capture local patterns and correlate closely with the queries.
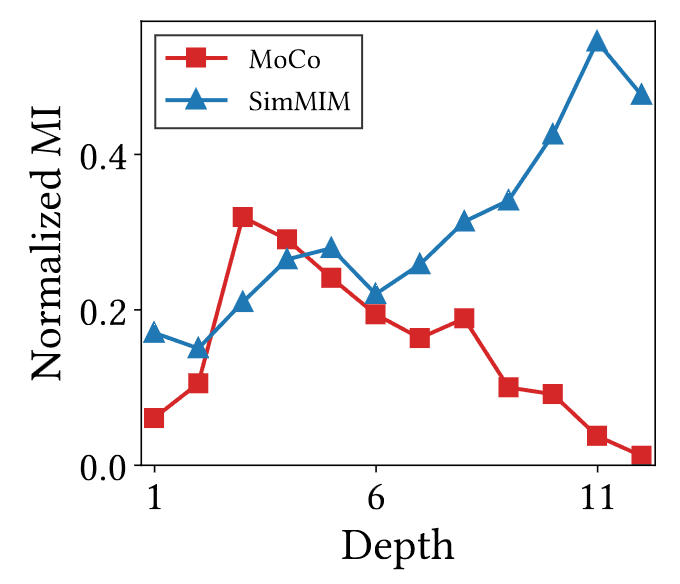
Attention Collapse
However, observe that all attention maps of CL capture the same shape information regardless of the query tokens, dubbed by an attention collapse into homogeneity. To measure such attention collapse, the authors utilized normalized mutual information (NMI):
\[\frac{\mathbb{I} (\mathbf{q}, \mathbf{k})}{\sqrt{\mathbb{H} (\mathbf{q}) \cdot \mathbb{H} (\mathbf{k})}}\]where
\[\begin{aligned} & \mathbb{I} (\mathbf{q}, \mathbf{k}) = \sum_{i=1}^{M} \sum_{j=1}^{N} p(\mathbf{q}_i, \mathbf{k}_j) \log \frac{p(\mathbf{q}_i, \mathbf{k}_j)}{p(\mathbf{q}_i), p(\mathbf{k}_j)} \\ & \mathbb{H} (\mathbf{q}) = \sum_{i=1}^{M} - p(\mathbf{q}_i) \log \mathbf{q}_i \\ & p (\mathbf{q}_i, \mathbf{k}_j) = \pi (\mathbf{k}_j \vert \mathbf{q}_i) p (\mathbf{q}_i) \\ & \pi (\mathbf{k}_j \vert \mathbf{q}_i) = \mathrm{softmax}(A \in \mathbb{R}^{M \times N}, \mathrm{dim} = 1) \end{aligned}\]For the distribution of query tokens $p(\mathbf{q})$, the authors assumed a uniform distribution $p(\mathbf{q}_i) = 1 / M$, where $M$ represents the number of tokens, as a single query token is provided for each spatial coordinate. Consequently, NMI measures the following phenomena:
- Low NMI values indicate that attention maps are less dependent on the query tokens, suggesting an attention collapse into homogeneity.
- High NMI values imply that the attention maps are strongly influenced by the query tokens.
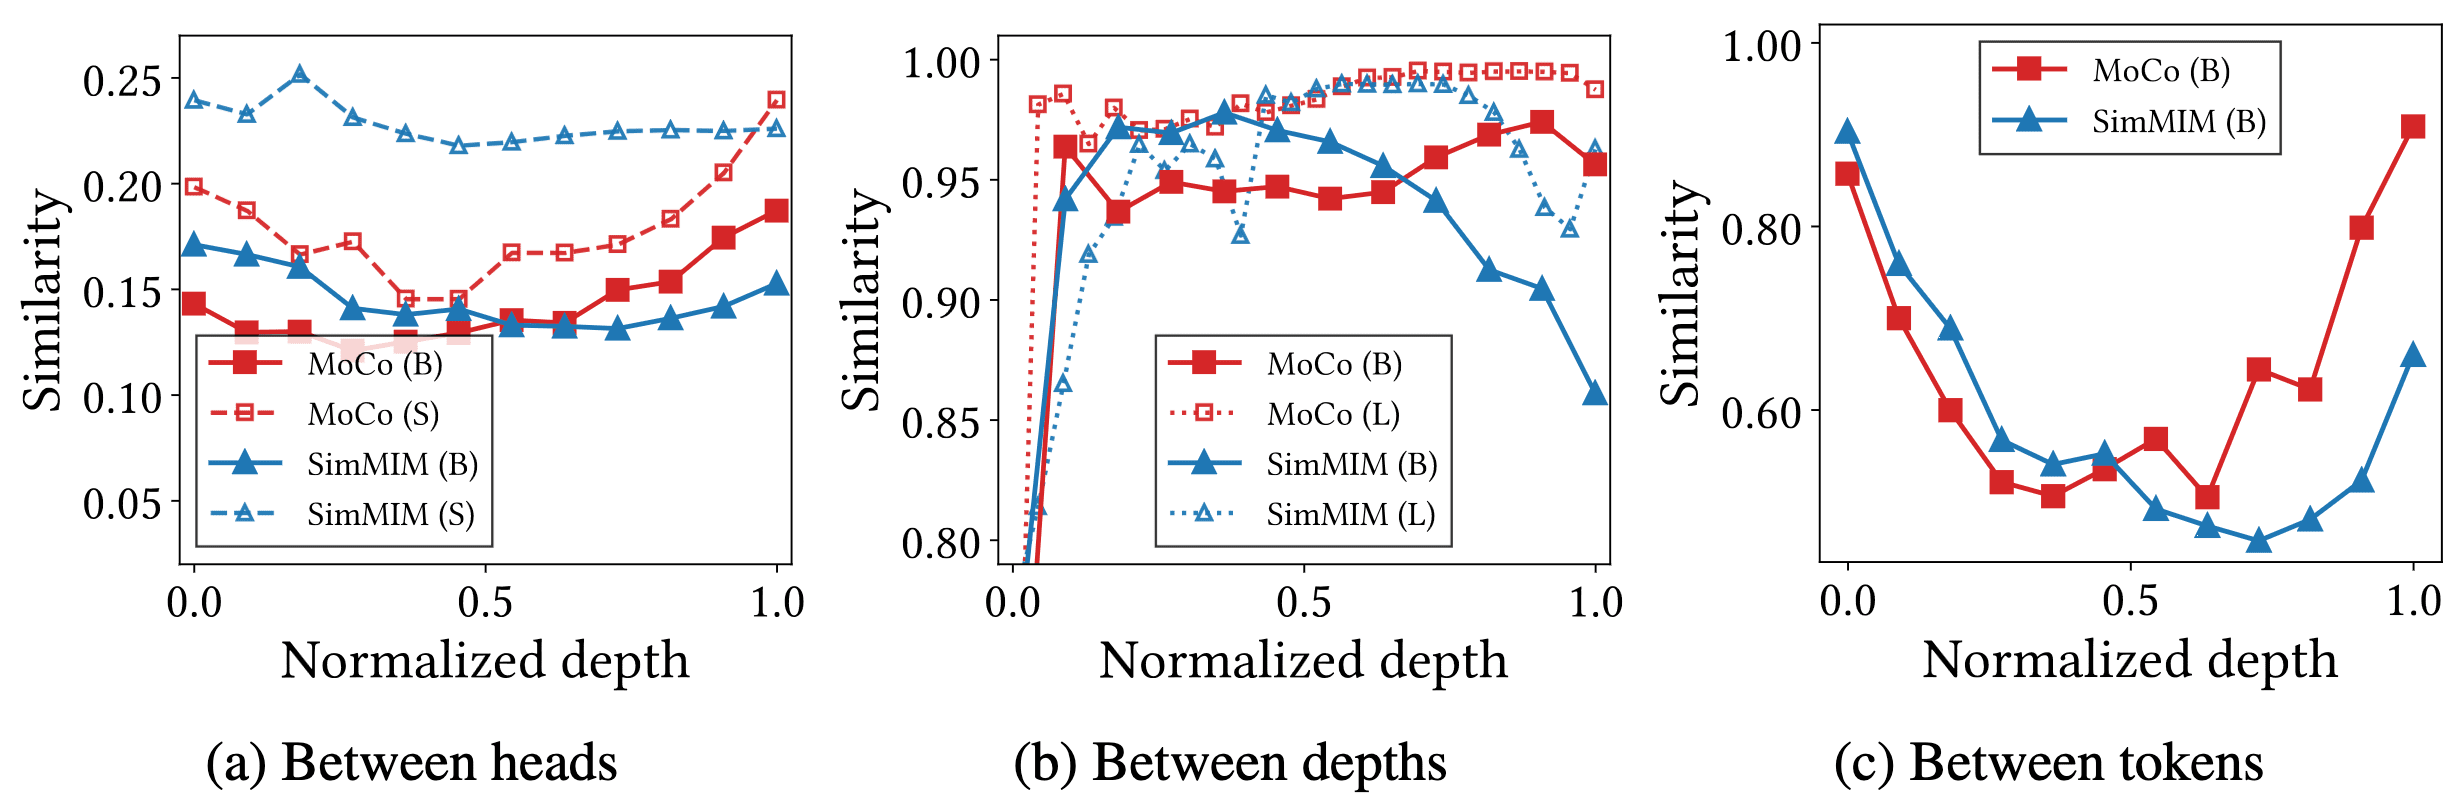
Measuring representational cosine similarities, the authors also observed that the representations of CL have significant homogeneity, supporting the observation from NMI. Contrast to MIM, even increasing the model size does not solve the problem CL has and may rather worsen it and add redundant modules.
Summary
In conclusion, the self-attention mechanism of CL captures global patterns and shapes of objects. However, CL suffers from attention collapse into homogeneity, reducing the diversity of token representations. In contrast, MIM primarily captures local patterns and thus avoids the attention collapse problem.
These behaviors of self-attention result in differences between the two approaches in various tasks:
- Linear Probing: CL > MIM
CL captures shapes, which helps object recognition and image differentiation. Although MIM preserves the diversity of representations, their correlation with objects or content may not be as strong as with shapes. - Fine-tuning: CL < MIM
Attention collapse prevents CL from fully exploiting the heads, depths, and tokens of ViTs. Since homogeneous representations are not very effective in enhancing token representations, ViTs trained with CL do not utilize the network's full capacity. Consequently, the fine-tuning accuracy of MIM is significantly higher than CL in large models. - Dense prediction: CL < MIM
CL is unsuitable for dense prediction since the token features are homogeneous with respect to their spatial coordinates
Behavior of Token Representation
Then, how the properties of self-attentions affect the token representations of ViTs?
Representation Transformation
The following figure visualizes $196$ ($14 \times 14$ patches) token representations before and after self-attention modules from a single image, using 3 rank approximation with SVD. It indicates that the self-attentions of CL translate all tokens in unison, while MIM applies a different transformation to individual tokens:
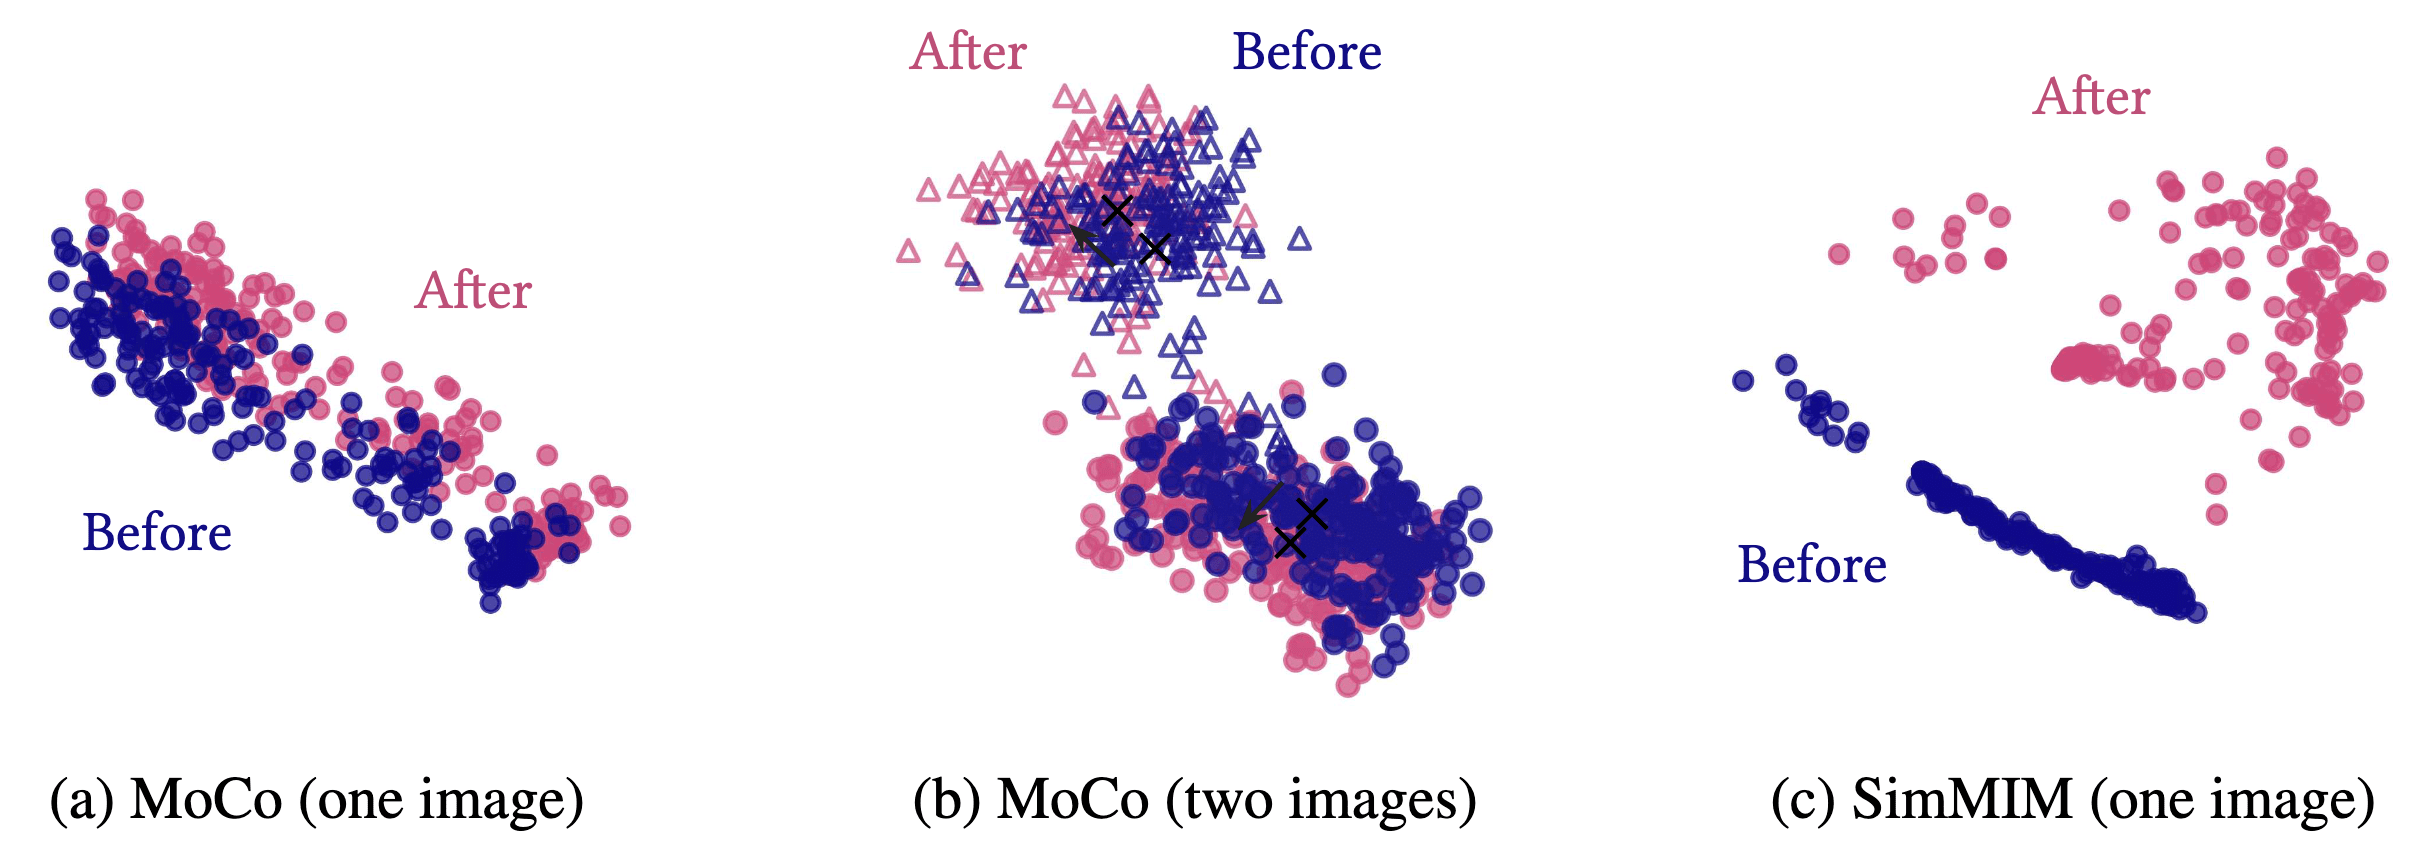
This phenomenon arises because the self-attention maps of CL are homogeneous; that is, self-attention is nearly independent of the spatial coordinates and query tokens. Consequently, the modules add a near-constant value to all token representations. As a result, the inter-representation distance and the volume of representations do not increase, implying that CL is less concerned with individual tokens. Instead, it distinguishes images by shifting the “centers of the representation distribution” apart, making the images linearly separable despite losing the ability to differentiate tokens.
Conversely, in MIM, distinct self-attentions are assigned to individual spatial tokens. Thus, MIM modifies the distance between tokens within a single image as well as the volume of the representation distribution.
Quantitatively, consistent results are observed in the singular value spectra, which visualize the singular values of a representation distribution and measure its volume.
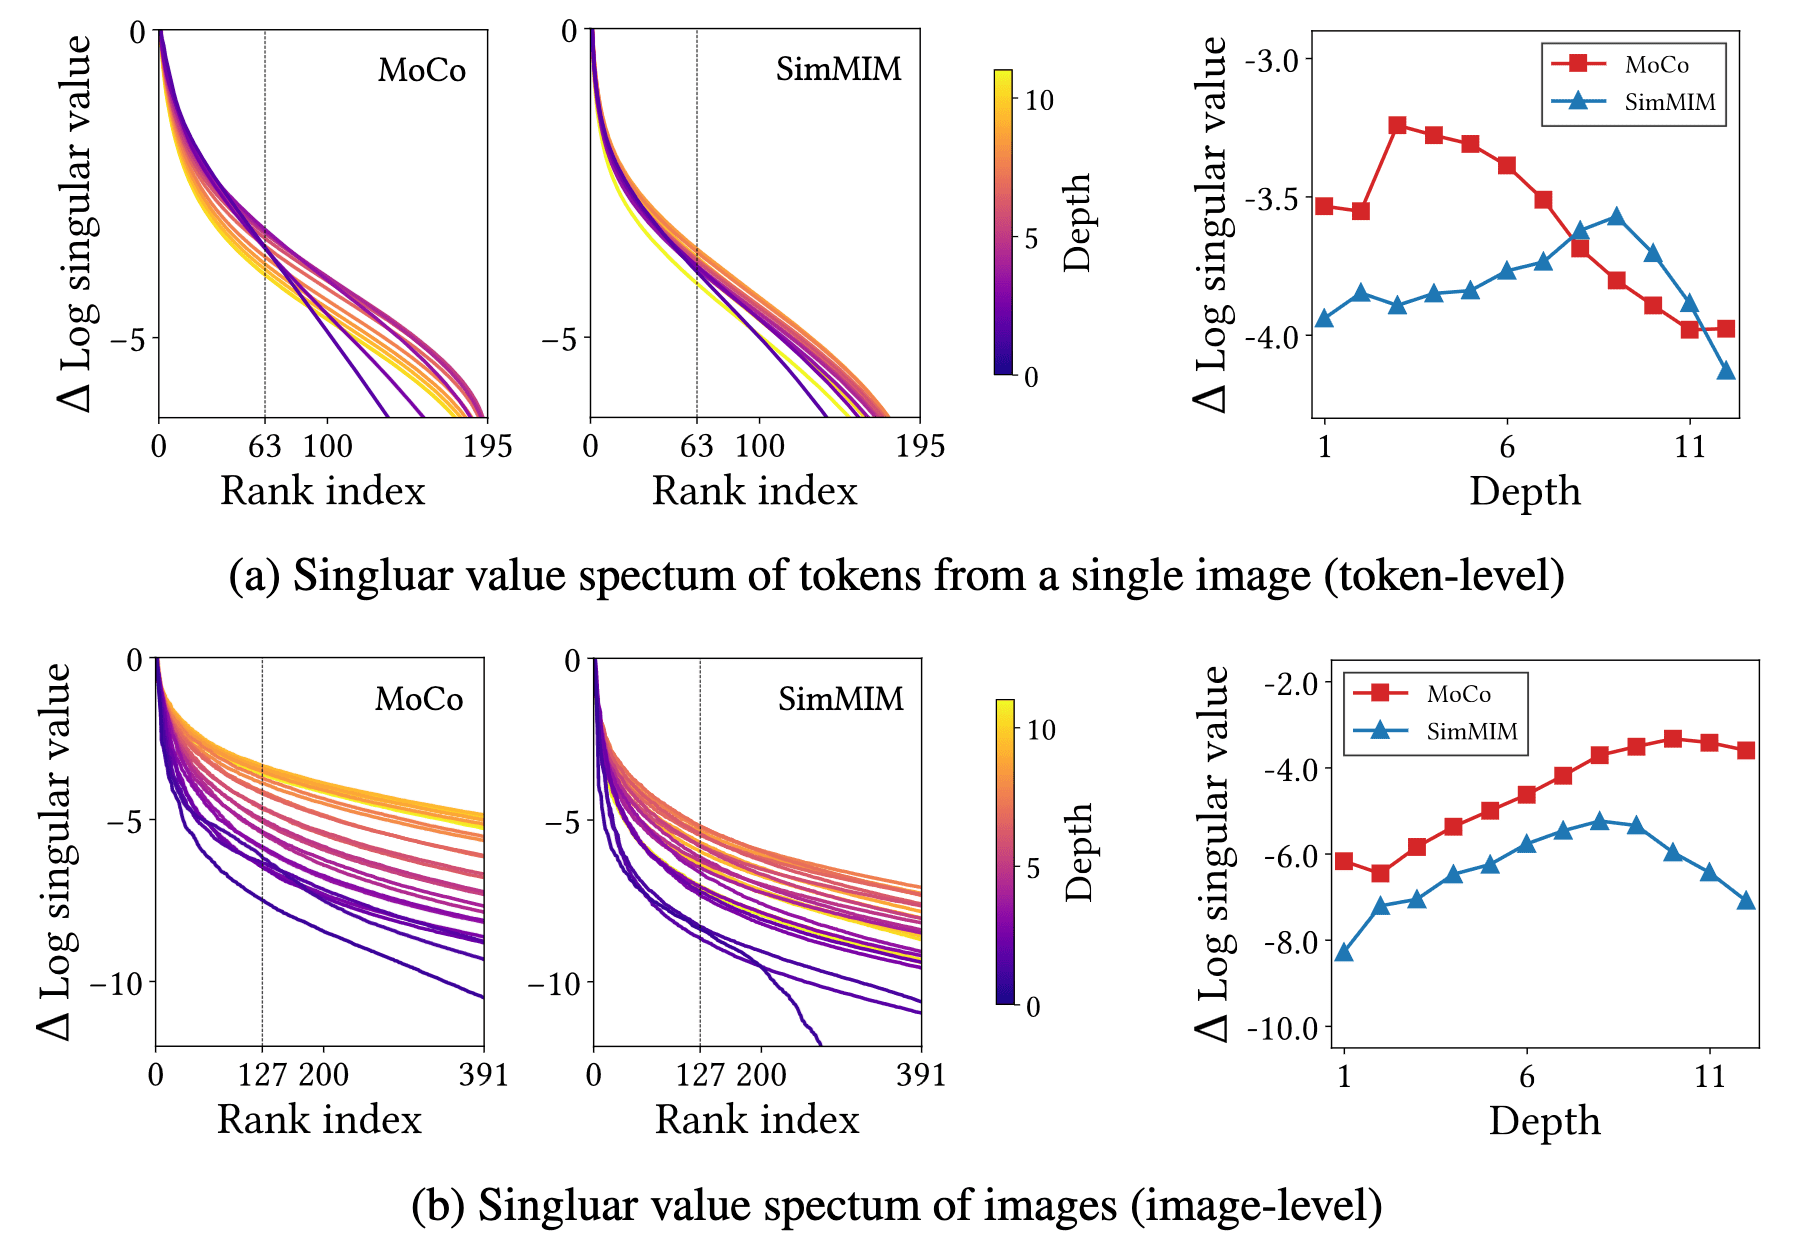
The CL layers exhibit minimal increase, or even a decrease, in singular values, which aligns with the previous explanation indicating CL’s limited ability to distinguish tokens. In contrast, MIM shows an increase in singular values, suggesting its capacity to alter token volumes and differentiate tokens effectively.
By averaging all tokens within an image to construct an image-level representation vector and conducting a singular value spectrum across these representations in the validation set, the authors noted that CL’s image-level representational volume surpasses that of MIM. This observation implies that CL enhances the separability of image-level representations.
Low-Frequency v.s. High-Frequency
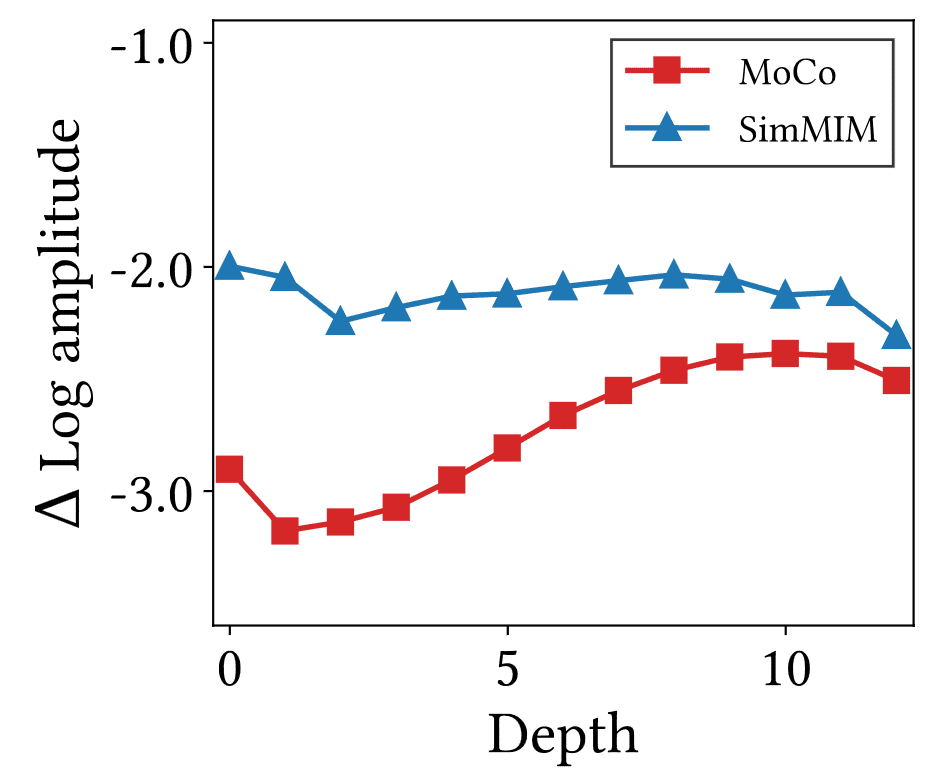
By visualizing the relative log-amplitude of Fourier-transformed representations and measuring the amplitude difference between the highest and lowest frequencies, the authors observed a notable difference: the high-frequency amplitude of CL is markedly smaller compared to that of MIM.
This suggests that CL primarily captures low-frequency information, whereas MIM focuses on high-frequency details in spatial dimensions. This difference can also be attributed to the global and local relationships of CL and MIM: CL leverages image-level self-supervision to detect overarching patterns, whereas MIM utilizes token-level self-supervision to exploit local patterns.
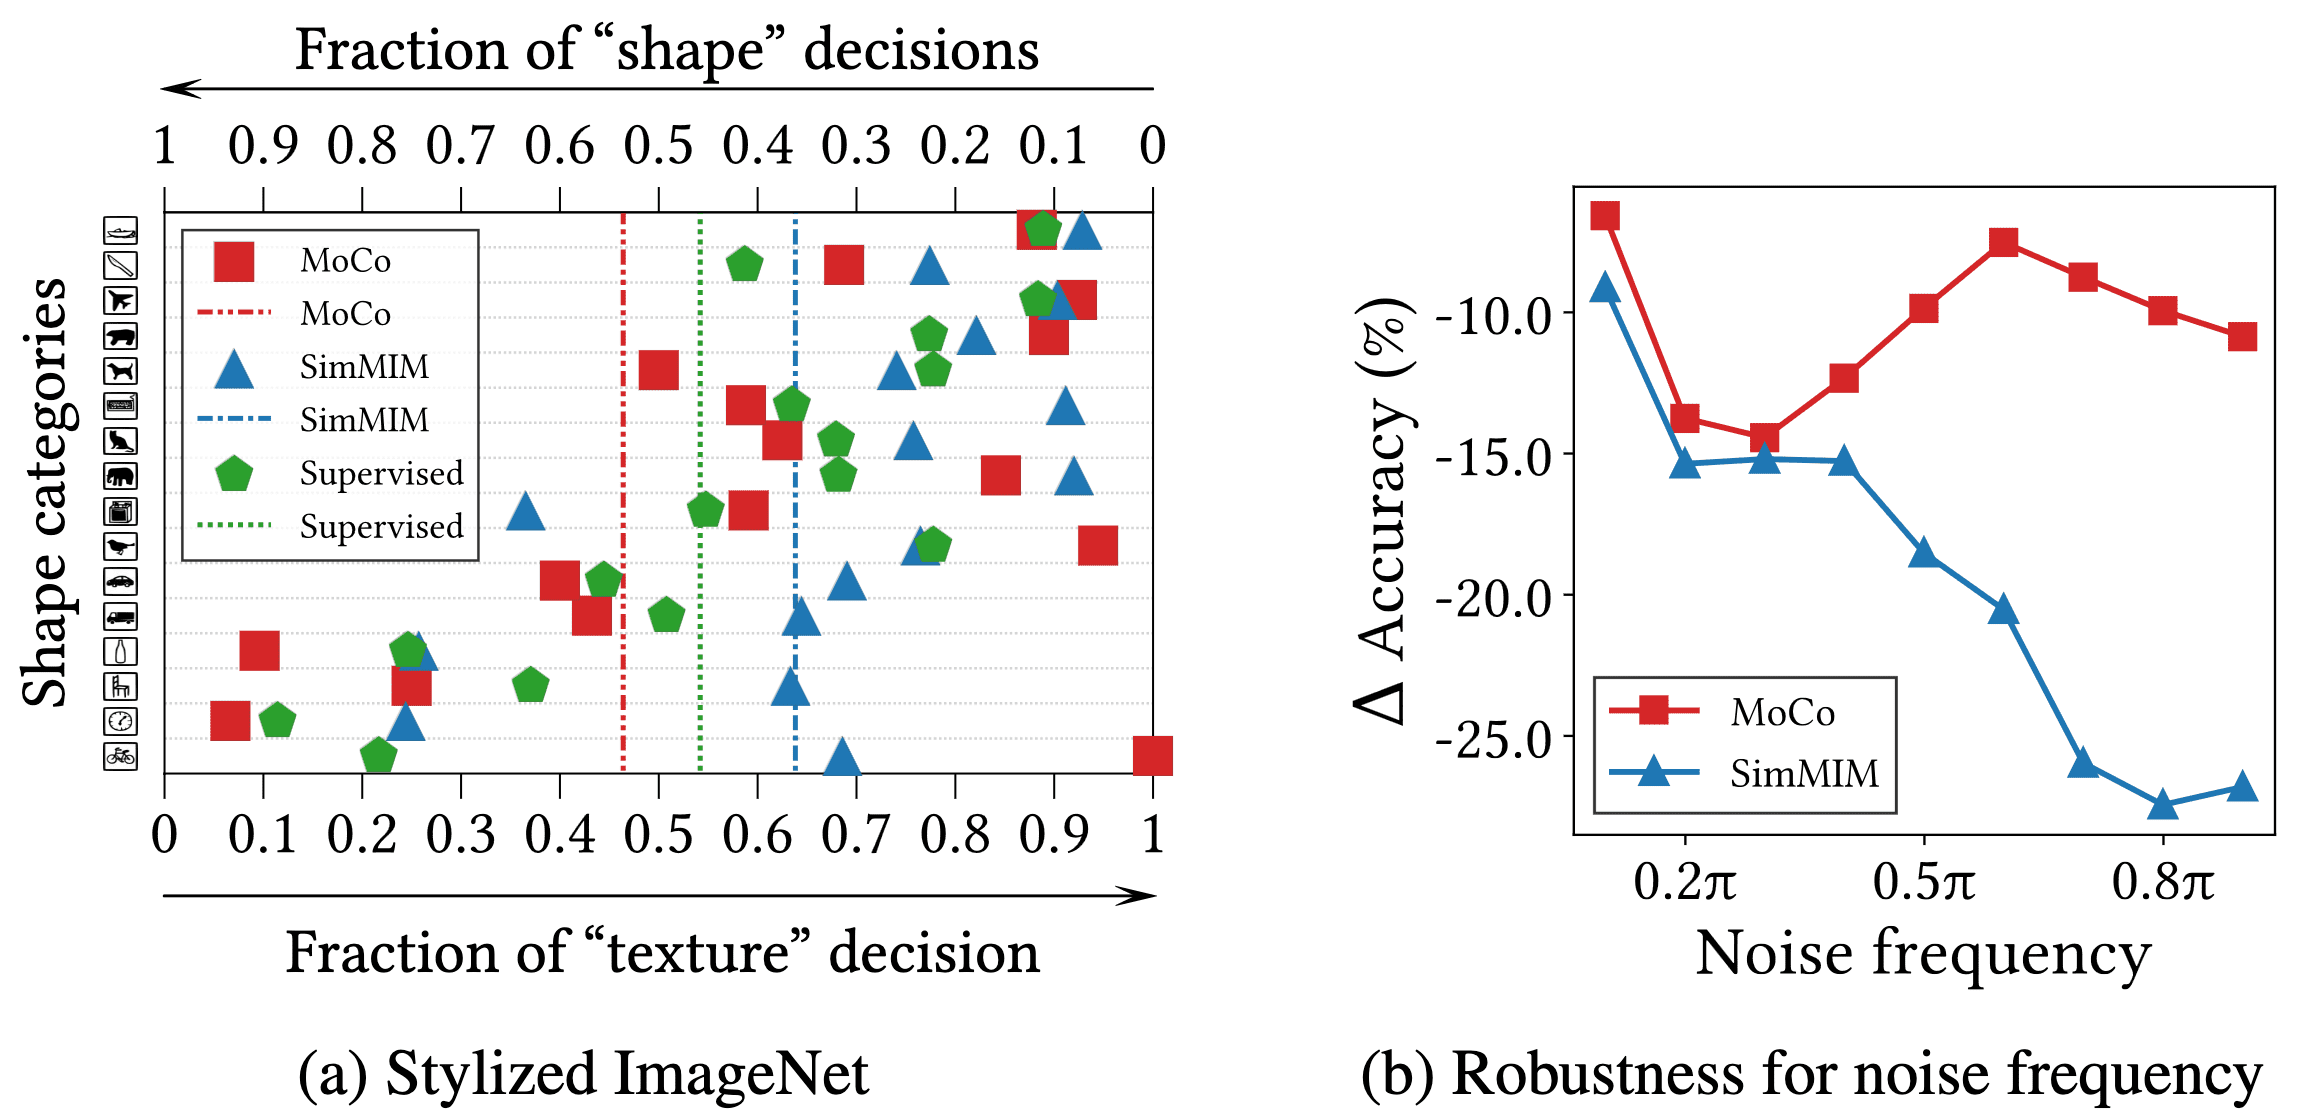
Shape-biased v.s. Texture-biased
The authors demonstrated the impact of information frequency using Stylized ImageNet, a stylized variant of ImageNet created with AdaIN. The results of linear probing on Stylized ImageNet indicate that CL relies more on the form, whereas MIM relies on the texture of images for classification.
Additionally, the authors presented the decrease in accuracy when frequency-based random noise is introduced to the images. As a result, MIM exhibits a more pronounced decline in accuracy compared to CL when subjected to high-frequency noises, highlighting MIM’s bias towards texture.
Primary Layers
It is known that the later layers of ViTs utilize high-level information, whereas the early layers focus on low-level details. Therefore, it is reasonable to anticipate that the later layers of CL and the early layers of MIM are pivotal. This section examines ViTs from an architectural standpoint and demonstrates that the fundamental components in CL and MIM diverge significantly.
Early v.s. Later Layers
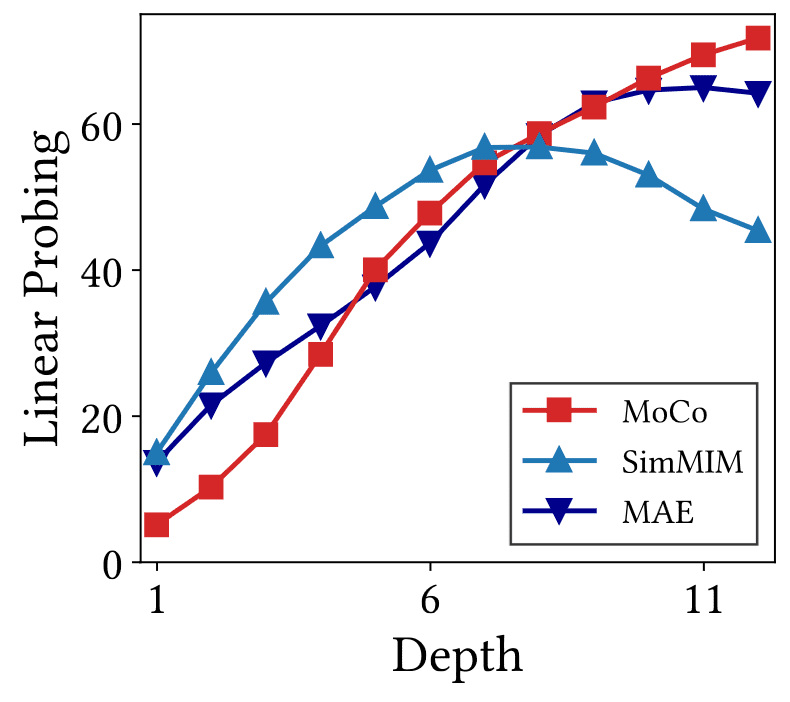
The following figure reports the linear probing accuracy using intermediate representations.
- Initially, MIM exhibits higher linear probing accuracy compared to CL. However, towards the end of the model, CL surpasses MIM in performance.
- The accuracy of CL rises as depth increases, consistent with expectations. In contrast, MIM's accuracy unexpectedly declines towards the end of the model, indicating that the later layers of MIM are less effective in distinguishing representations.
- This phenomenon is attributed to shallow prediction heads in MIM methods like SimMIM, which use the later layers of the backbone as decoders.
- Consequently, MIM variants with a deeper self-attention decoder, such as MAE, are likely more beneficial for enhancing linear probing performance.
- Furthermore, this explains the reduction in high-frequency components and representational volumes observed in later layers of SimMIM.
- Even the highest linear probing accuracy of MIM is lower than that of CL.
Advantages from Explicit Decoder
As observed, the implicit decoder in MIM, particularly with a shallow prediction head like SimMIM, can hinder performance. MAE addresses this issue by introducing deep explicit ViT decoders that exclusively reconstruct masked tokens. The authors demonstrated that this explicit decoder enhances the ability of ViTs to leverage MIM’s advantages.
They found that the mutual information of MAE is lower than that of SimMIM in the later layers of the encoder but higher in the decoder. This suggests that the decoder in MAE reconstructs masked tokens based on neighboring tokens, emphasizing a different approach. Moreover, unlike SimMIM where the last four layers diminish high-frequency components, the later layers (excluding the last layer) of MAE maintain these components.
Furthermore, the decoder of MAE prioritizes low-frequency information compared to the encoder, enabling the backbone to effectively utilize high-frequency details.
Combining CL and MIM
Then, can we leverage the advantages of both methods by combining CL and MIM to train a backbone?
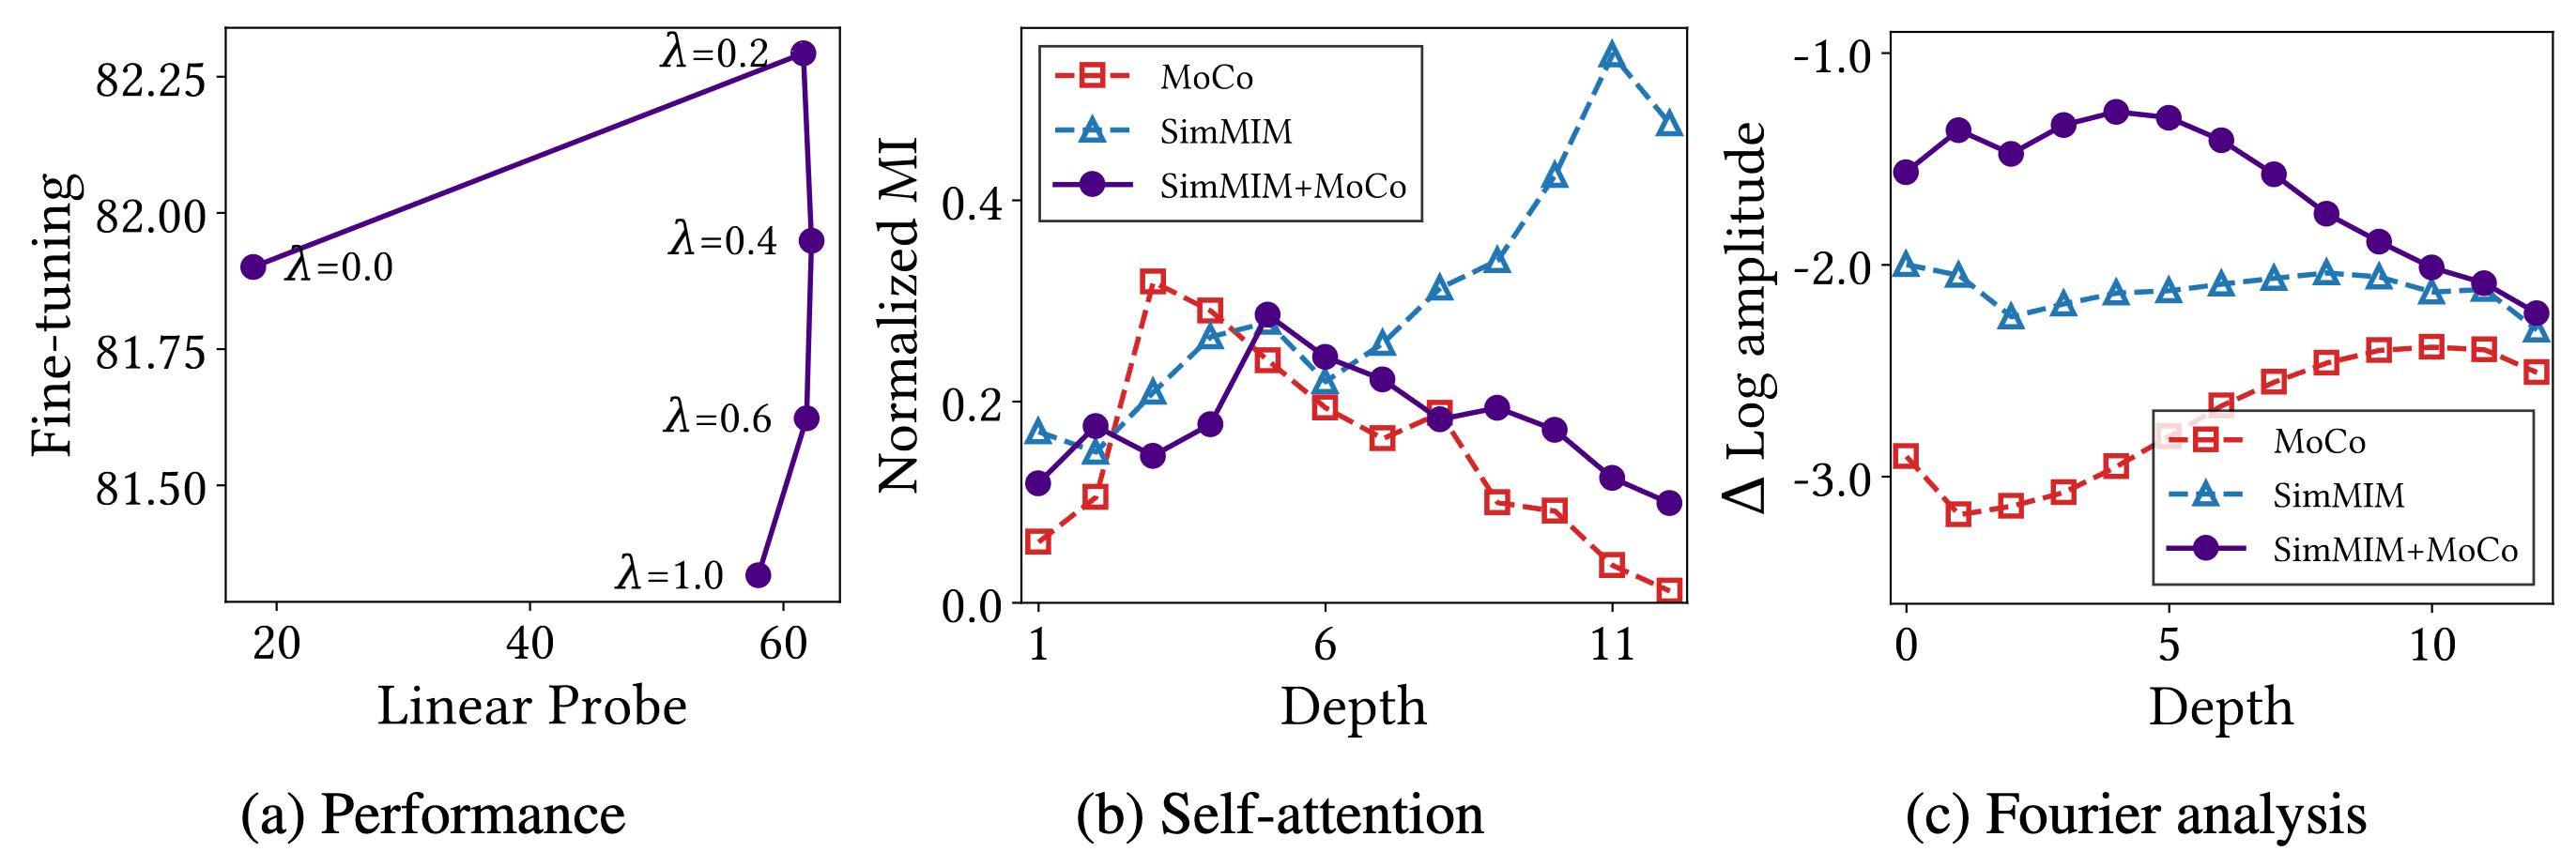
The authors simply harmonized two approaches by linearly combining two losses:
\[\mathcal{L} = \lambda \mathcal{L}_{\mathrm{CL}} + (1 - \lambda) \mathcal{L}_{\mathrm{MIM}} \text{ where } \lambda \in [0, 1]\]The following experiments show that the hybrid model exploits MIM properties in the early layers and CL properties in the later layers.
References
[1] Park et al., “What Do Self-Supervised Vision Transformers Learn?”, ICLR 2023
[2] Dosovitskiy et al., “An Image is Worth 16x16 Words: Transformers for Image Recognition at Scale”, ICLR 2021
[3] Heo et al., “Rethinking Spatial Dimensions of Vision Transformers”, ICCV 2021
Leave a comment